Fishing is one of the world’s oldest professions that provides sustenance for billions of people. While it is an essential segment of the ocean economy, it does have negative aspects. Overfishing, human-rights violations, and air pollution are just some of its many negative externalities. In this post, I want to focus on just one of its externalities: fishing boat emissions.
To keep things simple (and because I’m most familiar with the data), I’ll focus on the U.S. commercial fishing industry. These boats use internal combustion engines that burn gasoline and diesel fuel to provide mechanical and electrical power for propulsion, refrigeration, lighting, and any other number of energy end-uses on the vessel. The combustion of these fuels produces greenhouse gasses like carbon dioxide. But how much? Let’s estimate the CO2 emissions of the U.S. fishing fleet through two different methods.
Method 1 – Fishing Boat Emissions from Seafood Landings
The first method for estimation of fishing boat emissions uses the amount of seafood caught, or landings. What does seafood landings have to do with emissions? Researchers have calculated how much fuel it takes on average to harvest different ocean species and determined a median value of 639 liters of fuel per ton of seafood.
We could use these global median value, but to make this just a smidge more accurate, I’m going to use a smaller value of 430 liters fuel per ton which is the median for pollock or menhaden in North America which are the most harvested fish species here in the U.S. Other species, like lobster, are much more energy intensive, as we will see later. I’ll note that these values have a pretty big range, even for a given species and fishing method.
Now, if we know how much fuel is used, we can estimate emissions. We assume that the fuel is diesel and that each liter consumed results in approximately 2.7 kilograms of CO2 emissions.
Data on fish landings comes from the NOAA National Marine Fisheries Service. Note that I use 2022 data on the fishing fleet size, but here I’m using pre-pandemic values, due to disruptions in fishing operations in 2020 and 2021. Assume that the size of the fleet was the same in 2019 (and 2018 for a few states) and 2022.
Total seafood landings, fuel use, and CO2 emissions, from commercial fishing in the U.S. in 2019 and 2018, are shown in the table below.
| Year | Total US Seafood Landings (Metric Tons) | Total US Seafood Landings (USD) | Fuel Use (Liters) | CO2 Emissions |
|---|---|---|---|---|
| 2019 | 4,275,756 | $ 3,844,103,637 | 1,830,000,000 | 4,964,000 |
| 2018 | 4,247,235 | $ 3,910,037,310 | 1,826,000,000 | 4,931,000 |
Using seafood landings to estimate fishing boat emissions suggests 4.9 million metric tons from the U.S. commercial fishing fleet. If we do this calculation at the state level, the results are shown in the figure below. Using this method, Alaska’s fisheries produce more CO2 emissions than all other states combined. Before you go hollering at Alaska, just because a boat lands its catch in a state does not mean that the boat is registered in that state.
Method 2 – Fishing Boat Emissions from Vessel Characteristics
No two vessels are alike when it comes to energy consumption. Even seemingly identical ships will differ in fuel consumption due to variances in engine wear, hull biofouling, environmental conditions, or numerous other factors. There are approximately 16,300 fishing boats registered in the United States, catching everything from shrimp and scallops to salmon and skipjack. They are scattered throughout the U.S. coastal states with large concentrations in Alaska, Maine, Washington, and Massachusetts.
At a national fleet level, consider some basic characteristics on registered commercial fishing boats using data from the U.S. Coast Guard (USCG), shown in the table below.
| Characteristic | Minimum | Mean | Maximum |
|---|---|---|---|
| Length (ft) | 7 | 46 | 353 |
| Breadth (ft) | 8 | 15 | 116 |
| Gross tons (tons) | 5 | 34 | 4,555 |
| Main engine rated power (hp) | 10 | 498 | 11,050 |
As shown in the table, the fishing fleet is pretty diverse in terms of size, tonnage, and engine size. For any given vessel characteristic there is a wide-range of values across the fleet. Fleet-wide averages would probably be decent for an estimation, but this doesn’t acknowledge the uniqueness of each vessel. This next estimation method will try to consider the uniqueness of each vessel.
Estimating emissions vessel-by-vessel requires some key variables for each ship, including: rated power for the vessel’s engine; engine load; emissions factor; and length of time operated. The simplified equation for estimating emissions expressed in pseudo-math is:
CO2 Emissions = Engine Power x Engine Hours x Load Factor x Emission Factor
Unfortunately, the data I have access to does not have values for all of these variables for each and every single vessel. Hell, even fleet averages for some of these variables are hard to come by. So we’ll have to get crafty.
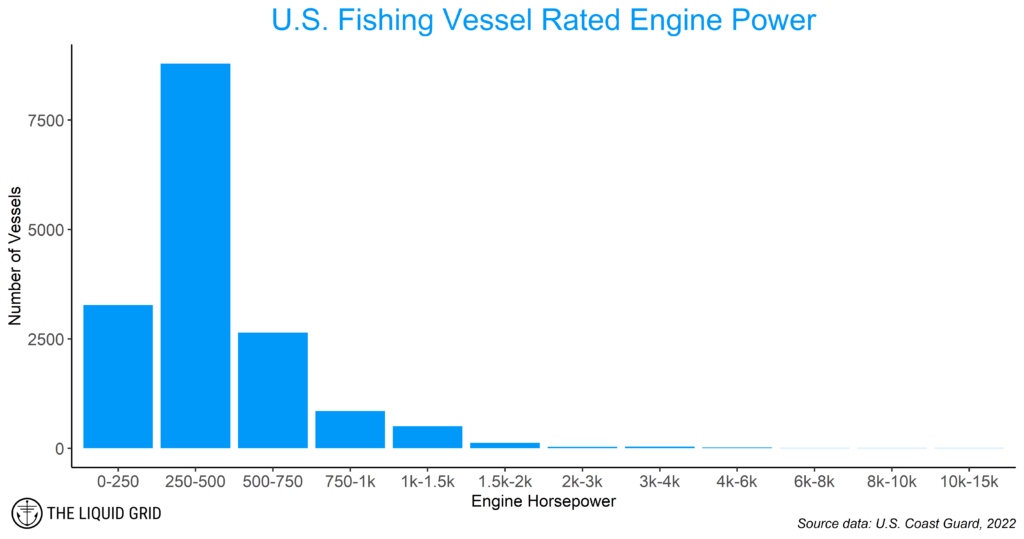
First, engine size. Of the 16,300 fishing boats in the USCG dataset, approximately 9,300 don’t have a specified horsepower rating. Fortunately, I have other ship variables I can use with a custom machine learning algorithm I developed to estimate the power rating when it’s not reported. The distribution of engine size across the fleet is shown below.
Operating hours and load factor for a ship’s engine vary tremendously depending on the boat type, fishing method, weather, time of year, and numerous other factors. I don’t know what the distribution of operating hours or engine load factors looks like across the entire fleet, but I did find some point estimates.
Without a distribution to suggest anything different, I assume that engine operating hours are random with equal probability to operate for as little as 170 hours or as much as 2,000 hours each year, or any value in-between. I use the same approach for engine load factor, using a range of 0.2 – 0.8, selected at random for each vessel. These values and the references are explained in more detail at the bottom of this article.
Applying the formula above to each vessel and then summing across the all vessels results in an estimate of 2.543 million tons of CO2. This is about half of the other method where I used fish landings. One reason for the discrepancy is that I’m only considering propulsion engines in this estimate. Larger fishing vessels will likely have auxiliary diesel engines that are used for electricity generation and boilers for heating, both of which require fuel and emit greenhouse gasses. Including this equipment would narrow the difference between the two slightly.
U.S. Fishing Fleet Emissions
These two estimation methods suggest that U.S. fishing boat emissions are likely somewhere in the neighborhood of 2.5 million and 4.9 million tons of CO2 each year. This is a pretty big range, and it’s hard to say which is closer to the true value, but my suspicion is that 2.5 million tons is closer to the mark. To contextualize this value, 2.5 million tons of CO2 from 16,300 fishing vessels is equivalent to the annual emissions of approximately 500,000 cars.
The Climate Cost of a Fishing Boat
Out of curiosity, let’s see what insights we can glean by pairing emissions estimates with economic contributions from harvested seafood and vessel registry data. Below is a chart showing the commercial value of seafood landings in 2019. Big caveat: I’m fairly certain that seafood landings within a state aren’t only due to the vessels registered in that state, but I couldn’t verify this. Still, I think it is safe to say that the vast majority of fishing boats are registered in the state in which they fish.
Alaska is the clear winner in terms of number of fishing boats, amount of seafood landed, and economic contribution. What if we compare Alaska, Washington, Maine, and Massachusetts on a per-vessel basis? The data suggests boats in Massachusetts generate 33% more economic value than Alaska, despite landing 86% less catch by mass. This of course is due to the type of seafood being harvested in the state. A quick investigation on the NOAA National Marine Fisheries Service website tells us the biggest commercial fishery in Massachusetts is scallops while in Alaska it’s pollock. In 2019, Pollock was being exported for about $3,000 per ton while scallops were about $30,5000 per ton. There you have it.
| State | Avg Seafood Landed (MT) / Vessel | Avg Value Landings (USD) / Vessel | Avg Annual CO2 Emissions (MT) / Vessel | Tons CO2 Emission / Tons Seafood Landed |
|---|---|---|---|---|
| Alaska | 678 | $465,281 | 144 | 0.212 |
| Massachusetts | 96 | $618,568 | 169 | 1.760 |
| Washington | 70 | $282,340 | 221 | 3.157 |
| Maine | 36 | $288,643 | 154 | 4.277 |
This bar napkin math suggests that the average fishing vessel in Washington state contributes less to the economy than the average vessel in other top-producing states, and those WA ships emit some of the most CO2 on average.
Before anyone starts finger-pointing, let it be known that this methodology is far from perfect. Then again, as the saying goes: all models are wrong, but some are useful. AIS data from operating vessels and further refinement of the analysis might improve the accuracy a bit, but there will still be limitations. Perhaps the best method would be if each boat reported their fuel use for the year, but this is as likely as catching a Chinese paddlefish (hint: impossible).
Fishing is an important part of the ocean economy that provides work for millions and feeds billions. However, as we look to transition the ocean economy to a sustainable blue economy, we need to find ways to reduce commercial fishing’s negative externalities and reducing CO2 emissions is a great place to start.
Appendix
Average Rated Engine Power
USCG data for fishing boats shows the average rated engine power is approximately 500 hp (368 kW). EPA Port Emissions Inventory Guidance (Table G.1) suggests a default value of 1219 hp (909 kW), but this seems high given the distribution of engine sizes in the USCG data set. I split the difference and use 640 kW.
Operating Time
There aren’t a lot of data sources to point to for operating hours of fishing boats, and it depends on a lot of different factors (seasonal fishing, regulations, customer demand, etc.). The EPA’s Port Emissions Inventory Guidance (Table G.1) suggests default values of 170 hours for the main engine of fishing boats, but it’s not clear where this data comes from and frankly it seems very low since a typical recreational boat is used for approximately 150 hours a year. A separate analysis of grant applications to the California Air Resources Board finds an average of 1,005 hours. This reference from engine manufacturer Caterpillar suggests annual operating hours of 1000 to 4000 per year for fishing boats.
Load Factor and Emissions Factor
The amount of fuel that an engine consumes is directly proportional to how hard it’s working. Just like you aren’t driving your car around with the pedal-to-the-metal constantly (at least I hope not), marine engines are operated at a fraction of what they could do. The load factor for fishing boats comes from an analysis by the California Air Resources Board and is corroborated by Caterpillar. The emissions factor value of 679 g CO2/kWh comes from the EPA’s Port Emissions Inventory Guidance (Table H.7).